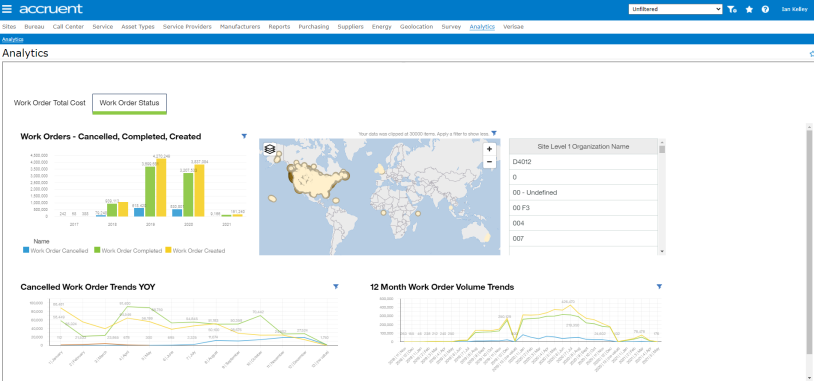
Analytics
The Analytics page includes an Analytics Engine that allows you to view work order data in an easy-to-navigate dashboard.
The Analytics Engine is purpose-built to deliver clear insights from your work orders data to drive informed decisions across your facilities portfolio. These analytics dashboards offer greater visibility by eliminating the need for users to log into a separate system to access, monitor and visualize their data.
The reporting dashboard interface populates data specific to user roles, allowing you to view work order trends that can be filtered at the organizational level. In addition, the dashboard enables users to see trends across hundreds of sites or simply drill down to a single site.
See trends across your:
- Work Order Types
- Work Order Costs
- Work Order Status
Work Order Total Cost
The Work Order Total Cost section displays:
- Chart displaying % Work Order Types
- Map plotting selected sites
- Rolling selector allowing you to drill down to specific sectors or sites
- Chart displaying Work Order Cost
- 12 month time-line chart of Work Order Cost
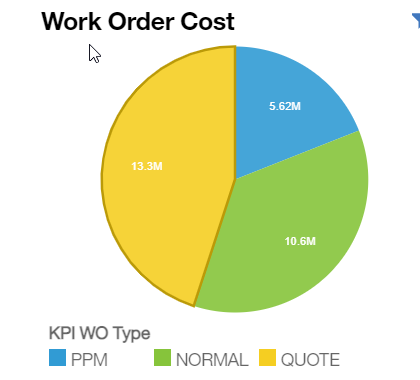
% Work Order Types
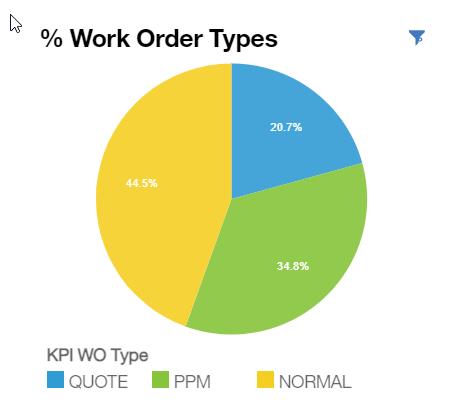
Work Order Types Pie Chart:
% of total work order spend broken out by work order type for current year – previous 12 months
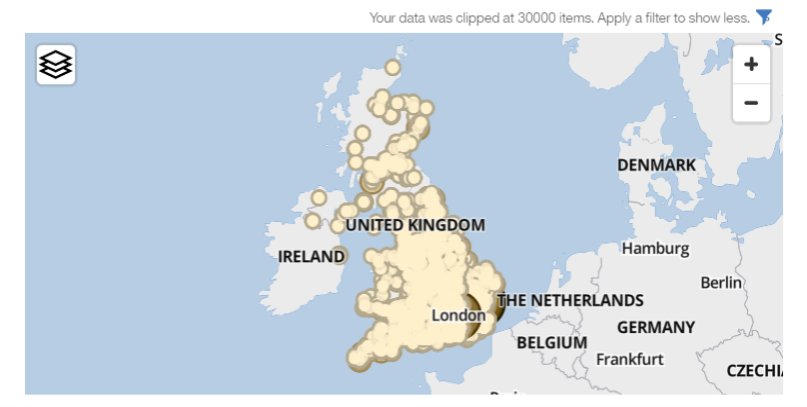
Map
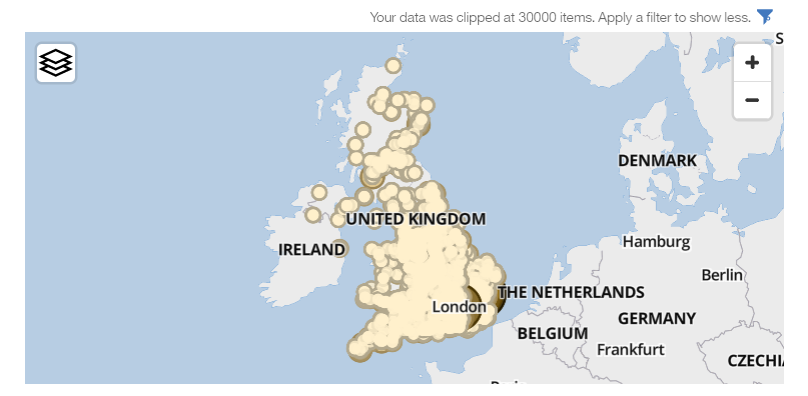
As you drill up or down your organization, the map will change to reflect the location of your chosen sites.
- Click the +/- button to zoom in or out on your map.
- Click the Filter button to change or remove layers from your map.
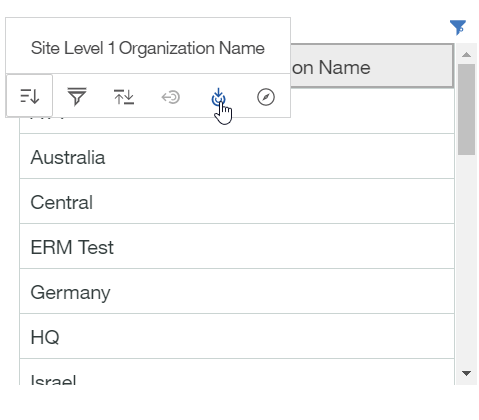
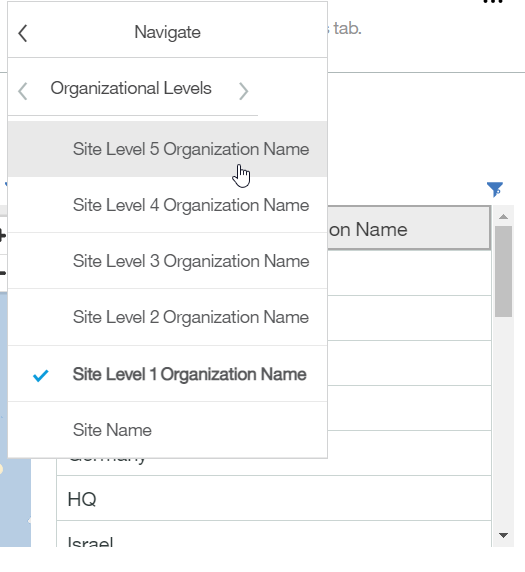
Site Level Selector
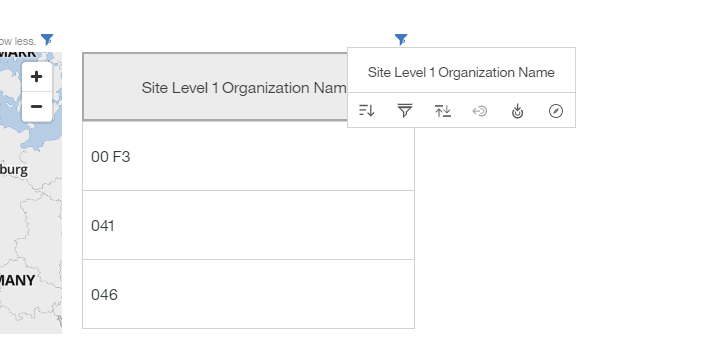
Right-click the selector header (currently reads Site Level 1 Organization Name) to pull up available filters for this div.
Filters include:
- Sort: Sort ascending (default) or descending
- Filter: (See below)
- Back: Brings you back one level
- Drill down: Drills down one organizational level
- Navigate: Allows you to choose the level of the organization
Filter
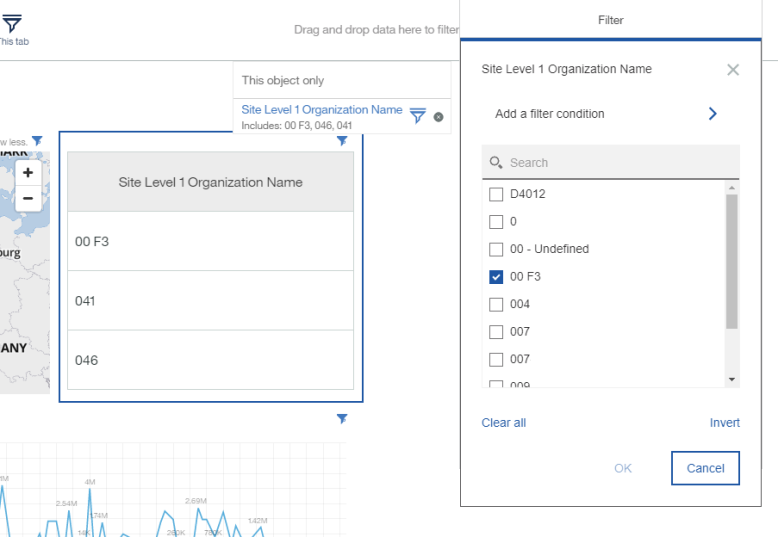 The Site Level Organization field is a scrolling selector. Make sure you scroll down to see your full list of sites.
 Work Order Cost
The Work Order Cost chart allows you to visualize the segmentation of Work Order Cost across your selected sites.
Click the filter button to change the visualization of the data you are displaying.
Clicking within the graph will cause the map, the site level scrolling site field, and the 12 Month Work Order Cost to update, reflecting the new filtered data.12 Month Work Order Cost
12 Month Work Order Cost is a line chart that graphs WO type cost over time.
The data used to reflect the graph is dependent upon the filters you use to narrow your criteria.
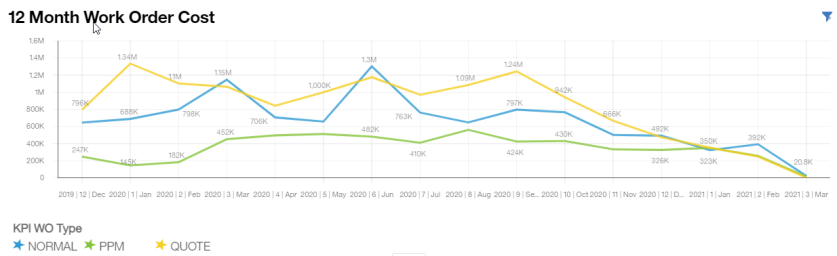
Current year: Previous 12 months
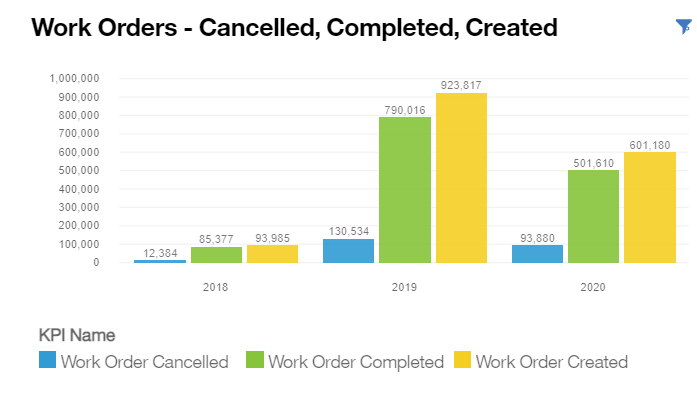
Work Order Status
The Work Order Status section displays:
- Chart displaying Cancelled, Completed, and Created Work Orders
- Map plotting selected sites
- Rolling selector allowing you to drill down to specific sectors or sites
- Chart displaying Cancelled WO Trends YOY
- 12 month Work Order Volume Trends
Work Orders: Cancelled, Completed, Created
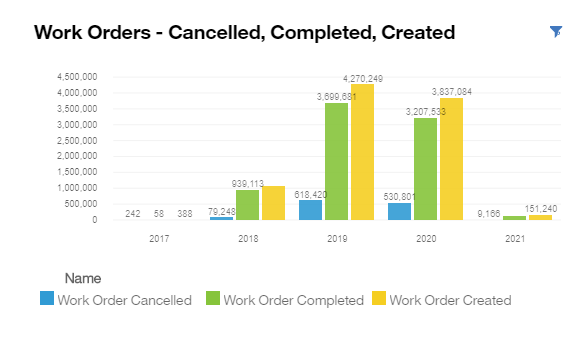
The Work Orders: Cancelled, Completed, Created chart allows you to visualize the segmentation of Work Orders across your selected sites.
Click the filter button to change the visualization of the data you are displaying.
Map
As you drill up or down your organization the map will change to reflect the location of your chosen sites.
- Click the +/- button to zoom in or out on your map.
- Click the Filter button to change or remove site locations from your map.
Site Level Selector
Right click to drill down or navigate through levels.
Filters include:
- Sort: Sort ascending (default) or descending
- Filter: Filter down to a specific site or segment of sites
- Back: Brings you back one level
- Drill down: Drills down one organizational level
- Navigate: Allows you to choose the level of the organization
Filter
The Filter button allows you to add a filter condition and select specific sites for which you would like to see data.
The Site Level Organization field is a scrolling selector. Make sure you scroll down to see your full list of sites.Cancelled Work Order Trends YOY
Work order counts for Cancelled, Completed, Created WOs broken out by year for rolling 24 months
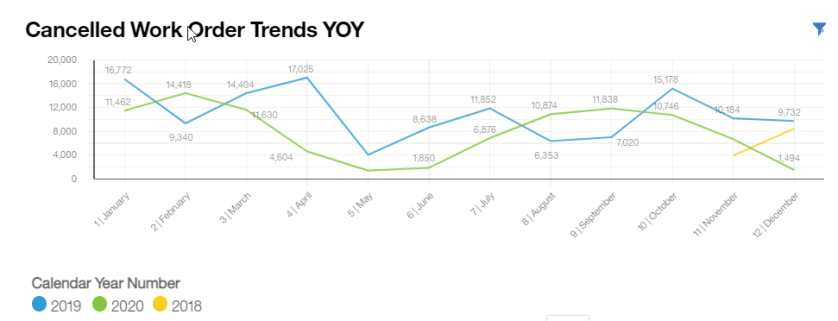
Cancelled work orders counts broken out by year/month for rolling 24 months
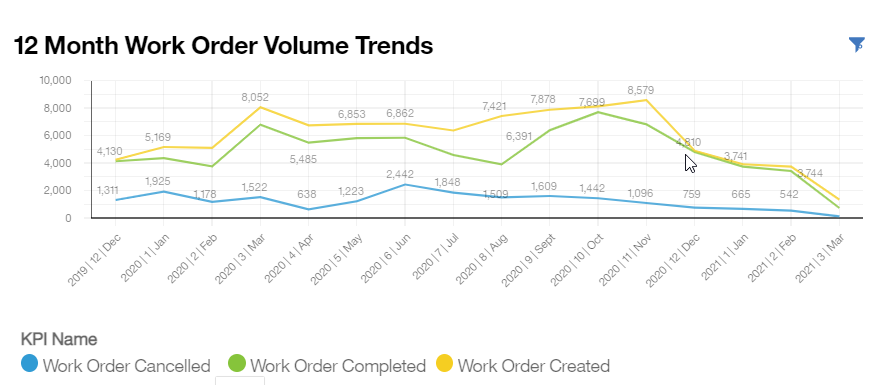
Total work order counts for current year – previous 12 months broken out by month/year
Summary
With the Analytics tab, you can seamlessly capture a wealth of data to quickly identify potential cost savings and efficiency gains to better manage your maintenance operations.