Chart Wizard
This procedure illustrates how to add a chart to a Designer Report. We'll assume that you are working on an existing designer report in the TMS Report Designer. Notice the two buttons in the Design ribbon, Add Chart Field and Add Gradient Field. Both buttons launch a wizard that guides you through adding a chart to a report. To add a chart, follow these steps.
-
Click the Add Chart Field button.
The Chart Wizard screen opens. The screen shot below shows the Chart Wizard. Notice that in this screen shot, the Line chart type is enabled and you can see the preview in the left corner. There are six other Chart Types available for you: Bar, Area, Scatter, Pie, Line, Column.
-
Select the option button for the type of chart you want to add.
-
Click Next.
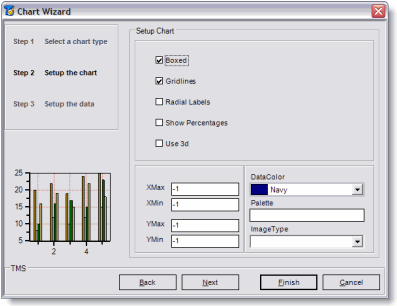
This is Step 2, where you setup the chart. Notice the five options: Boxed, Gridlines, Radial Labels, Show Percentages, Use 3d. Each one does something different in the report. If you check one of the options, you can view the preview in the lower left corner. The screen shot below shows a Bar type chart with the options Boxed and Gridlines checked.

The minimum and maximum (XMax, XMin, YMax, YMin) are the minimum and maximum value points on the chart. If you leave the value as -1, the chart automatically computes the minimum and maximum value point on the chart. You can specify your own if you want. However, if you specify 100 and the value is 101 then the bar goes off the chart.
-
Select your data color.
The palette allows you to identify a different color for each data point, up to six data points. This is a text field where you type in the colors separated by a semicolon.
-
Select the Image Type.
Your choices are: Emf, Png, Gif, Jpeg, Bmp. The screen shot below shows a DataColor of red, Palette, and ImageType of Gif.
-
Click Next.
This is Step 3 of the Chart Wizard where you Setup the data. Notice the RecordSource field. Here you can manually type in a data source or you can use the SQL Builder to build a data source. For more information on the SQL Builder, read the SQL Builder Wizard help topic.
-
In the RecordSource field, type in the SQL statement or use the SQL Builder Wizard to build the SQL.
The screen shot below shows SQL entered into the RecordSource field. Notice we used TypeCode for DataX and WOcnt for DataY.
You can also leave this screen blank to use the SQL from the report itself.
-
Click Finish.
You are returned to the Report Designer. The cursor changes to a + .
-
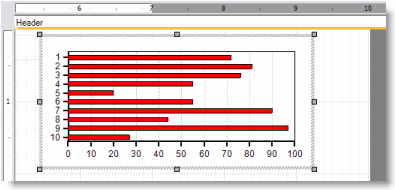
Use the cursor to drag and drop the chart into the report.

