Reports
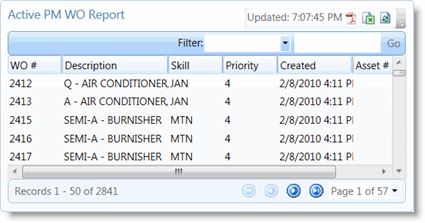
Reports in TMS Dashboard are data sources and report definitions from your TMS database that are shown in the form of a grid. These grids support filtering, sorting, and paging of the data in the report.
Filter
The Filter drop-down menu and textbox allow you to filter the results by one of the report’s columns. Use the Filter drop-down menu to select a report column and the Filter textbox to type in criteria. After making your selections, click Go to see the filtered results.
Sort
To sort results by a column in the report, click the column heading label. Clickce to sort the column in ascending order (A to Z). Click again to sort the column in descending order (Z to A). Click a third time to return the results to the original order.
Paging
If the report has more than 50 records, paging allows you to see all of the results (50 records per page). There are paging buttons at the bottom of the report. Click First to go to the first page of results. Click Next to go the next page. Click Prev to go to the previous page. Click Last to go to the last page of results. You can also use the Page button to go directly to a certain page in the results. Click Page to see a list of all the pages and select the page you want to go to.

Refresh the Data
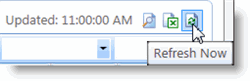
Like charts, reports in TMS Dashboard also have a refresh rate that determines how often the data is automatically refreshed. The last updated time is shown in the upper-right corner of the report. Refresh Now can be used to force a manual refresh of the data without having to wait until the next automatic refresh.