Set the Properties for a Data Source Grid
To view the current properties for a data source grid, select the data source in the designer. (Clicking at the top of the data source, near the name, works best.) The Widget Properties pane appears in the lower-right of the screen. The properties listed below are shown.
Data Source
This shows the name of the data source that the widget is currently tied to. You can change data sources on-the-fly by either typing a different data source name into the field, or by clicking the Lookup button and then searching for a different data source.
The Info button (i) allows you to open the data source in a child window so that you can make adjustments to it on-the-fly.
Refresh Rate
The Refresh Rate defaults to 0. This means that the chart will not automatically update.
If you want the data source to automatically refresh, enter a minutes value in the Refresh Rate field. The value entered here will determine how often the chart automatically refreshes.
You can also use the Refresh Now button in the upper right corner of the chart to do a manual update at any time.
Show Calendar
The Show Calendar option allows you to add a calendar above the report data. Highlighted dates on the calendar show dates that contain data. This makes viewing information for a given month faster.
For example, if we add a calendar to the Active PM WO Report, our Dashboard users will be able to see at a glance which dates on the calendar contain data relative to the report and which do not.
The number of months shown is dependent upon the size of the TMS application window. The larger the window size, the more months that will be visible in the calendar area. If you shrink the TMS application window size, less months will be visible.
Date Field for Calendar (only visible if "Show Calendar" is checked)
This drop-down menu is only available if the Show Calendar option is selected. It displays available date fields from the report. This drop-down menu is required when Show Calendar is enabled.
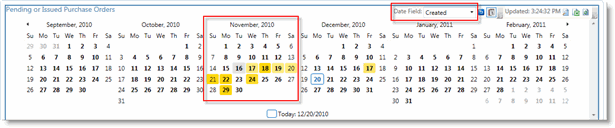
In the screen shown below, we have tied the DateCreated field on the report to the calendar field. The highlighted dates on the calendar are dates in which there are corresponding records. Our example uses the month of November in 2010.
Show/Hide Calendar Filter (only visible if "Show Calendar" is checked)
You might want to toggle the appearance of the calendar. If the calendar is visible, click the Show/Hide Calendar Filter button to hide the calendar. If the calendar is hidden from view, click the Show/Hide Calendar Filter button to make it visible again.

Key Performance Indicators (only visible if "Show Calendar" is checked)
There might be subsets of data that you want to further highlight for your Dashboard users. Say, for example, you want to tie the report's calendar field to the DateNeeded field in the Active PM WO Report. You might want to add a different type of highlight background to dates where there are five or more PM work orders needed. To do this, you would add a Key Performance Indicator (KPI).
To add KPIs, follow these steps:
-
Open your dashboard in the designer either by clicking the Edit button in Dashboard, next to the form drop-down menu (only available when you have Edit rights to the form), or by going to Setup > Dashboard > Edit and selecting the dashboard to edit.
-
Click the report widget.
-
Check the Show Calendar option.
-
Select the date field to tie to the calendar field from the Date Field for Calendar drop-down menu.
-
Under Key Performance Indicators, click New.
-
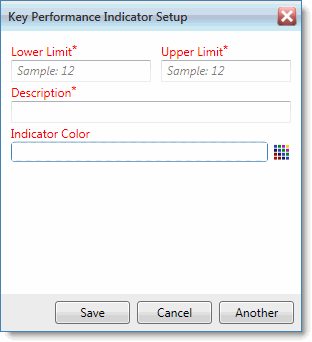
In the Key Performance Indicator window, enter the lowest end of the record range in the Lower Limit field. To use the example above, we will enter "5".
-
In the Upper Limit field, enter the highest end of the record range. We will enter "10". This means that this KPI will be applied to dates where there are 5 - 10 corresponding records.
-
Enter a Description of this Key Performance Indicator. For example, "Five to Ten work orders needed".
-
Select a color for the background highlight to differentiate these dates from the other highlighted dates on the calendar.
-
Click Save to close the window, or click Another to save this KPI and create another.
The highlighted backgrounds on the dates that match the KPI you created change to the color you specified.
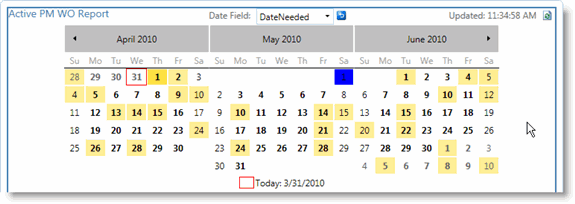
You can edit or delete a Key Performance Indicator with the Edit Selected KPI and Delete Selected KPI buttons in the Key Performance Indicators grid of the Widget Properties pane.