Set the Properties for a Data Source Chart
To view the current properties for a data source chart, select the data source in the designer. (Clicking at the top of the data source, near the name, works best.) The Widget Properties pane appears in the upper-right of the screen. The properties listed below are shown.
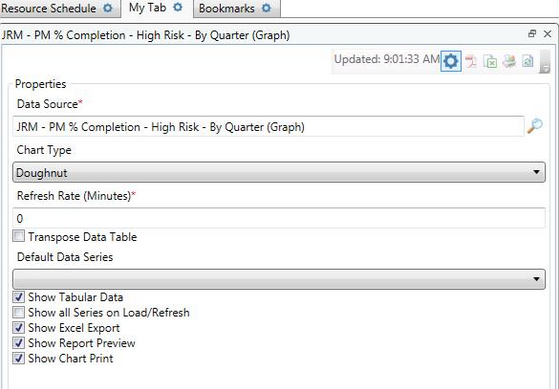
Data Source
This shows the name of the data source that the widget is currently tied to. You can change data sources on-the-fly by either typing a different data source name into the field, or by clicking Lookup and then searching for a different data source.
The Info button (i) allows you to open the data source in a child window so that you can make adjustments to it on-the-fly.
Chart Type
This displays the type of chart that you have selected for this report. See the Chart Types topic for a list of all available chart types.
Refresh Rate
The Refresh Rate defaults to 0. This means that the chart will not automatically update. If you want the data source to automatically refresh, enter a minutes value in the Refresh Rate field. The value entered here will determine how often the chart automatically refreshes.
You can also use the Refresh Now button in the upper right corner of the chart to do a manual update at any time.
Show all Series on Load/Refresh
The Show All Series on Load/Refresh option allows the user to see all the series of data in a single chart. This option does not have an affect on pie charts and doughnut charts.
Transpose Data Table
Transposing the data table switches which data is shown in rows with the data that is shown in columns and vice versa.
Default Data Series
If Show all Series on Load/Refresh is not checked, then the Default Data Series is all that will be shown in your graph.