Add a Data Source
Data sources can be added to a dashboard to display relevant information. Data sources are grouped in the Data Sources widgets list by Module and then by Category and Sub Category. These widgets might display in one of two ways: as a standard list grid or as a chart (Cross Tab data sources only).
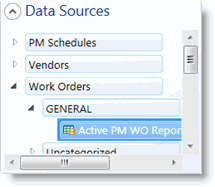
Data sources that will display as a grid on the dashboard show a rectangular grid icon next to its name, and data sources that will display as a chart show a circular chart icon next to its name.
To add a data source, follow these steps:
-
Open your dashboard in the designer either by clicking the Edit button in Dashboard, next to the form drop-down menu (only available when you have Edit rights to the form), or by going to Setup > Dashboard > Edit and selecting the dashboard to edit.
- Click one of the tabs that you previously created, or add a new tab.
- In the list of available widgets, click the arrow next to Data Sources. A list of TMS modules will appear below Data Sources.
- Click the arrow next to a module.
-
Click the arrow next to a category of data source. Data sources for that module and category/sub category are listed.
-
Click a data source and drag it onto the tab in the desired location. The data source's resulting data is displayed.
-
Click Save.
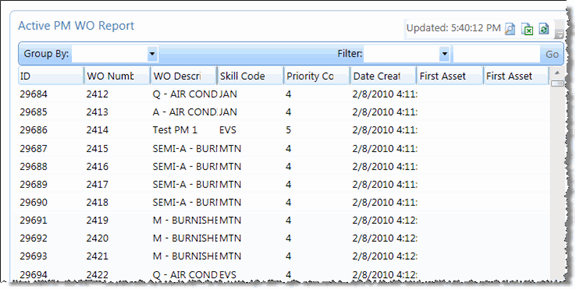
The screen shot below shows a grid data source we added to a tab.