My Dashboard
The My Dashboard page displays charts and graphs containing high-level facilities metrics data. Each chart or graph is displayed as a separate dashboard widget. You can easily customize your dashboard by selecting which widgets to include, selecting a different layout, dragging the widgets into different positions, and filtering the data displayed in each widget.
-
To open the My Dashboard page, click the Dashboard link at the top of the page.
- Click the My Dashboard tab.
When you first open the page, the Open Requests By Property widget is displayed containing a list of the open requests at your default property. You can add other widgets.
Every widget has a similar basic layout:
- Title Bar – At the top of the widget is a title bar containing the name of the widget and a Close button. You can move a widget by dragging it, by its title bar, to the desired position. You can close a widget by clicking the Close button.
- Filters – Below the title bar is a set of filters that allow you to change the data that is displayed. For example, you might filter a widget by region, property, or date. Once you have chosen your filters, click the Update button to apply them and display your results. If you filter a widget, the system remembers and automatically applies these filters the next time you open the My Dashboard page.
- Chart/Graph – At the bottom of the widget is a chart or graph that provides a visual representation of the data set selected. Many of these charts and graphs are interactive. You can obtain more information by scrolling over them or open additional windows by clicking the displayed data.
 Dashboard Page Layout
You can customize your My Dashboard page by changing the layout, adding widgets, moving widgets, and closing widgets. Every time you make a change to the dashboard layout, the system remembers it and re-opens the dashboard in that state, including the state of the selected filters. If you change the size your browser window, the widgets automatically re-size accordingly.
Change Layout
Currently, there are two layouts are available for your dashboard:
- Single pane – In the single pane layout, all widgets are sized to be the full width of the page and appear in a single column, one on top of the next.
- Double Pane – In the double pane layout, all widgets are sized to be one half of the width of the page and can be placed in either the right or the left column.
Initially, the dashboard is displayed in the double pane layout. To change the dashboard layout:
-
Click the Change Layout button at the top of the page.
-
Select the desired layout.
If you change the layout, the system automatically changes the size and position of your dashboard widgets accordingly. Once the layout is readjusted, you can move the widgets around.
Add a Widget
Adding a widget places one instance of an available widget on your dashboard. Once added, you can set the filters and move it to the desired location on the page. You can add multiple instances of a particular widget. For example, you could include several Open Requests By Property widgets, each displaying information about a different property you want to monitor.
To add a widget:
-
Click the Add Widget button.
The Widget List dialog box opens containing the list of available widgets you can add. Each widget is listed with a description of its contents and a thumbnail of the accompanying chart or graph.
-
Click the Add Widget button corresponding to the widget you want to add.
The widget is added to your dashboard. The dialog box remains open allowing you to add more widgets.
- Click the Close button when you have selected all of the widgets you want to add.
Move a Widget
Widgets can be moved around the page to provide the most effective view. Widgets can only be moved according to the selected page layout. For example, if you select the single pane layout, you cannot move a widget to the right or left of another widget.
To move a widget:
-
Click the title bar of the widget you want to move.
Your cursor changes to a Move cursor.
-
Drag the widget from its current position and drop it onto its new position.
As you drag, the previous position of the widget turns blue. As you move the widget around the page, all available positions for the widget are highlighted by a blue square. You may have to make several moves for multiple widgets to get them in the layout you want.
Close a Widget
Widgets can be closed if you no longer need them. When you close a widget, the widget is removed from your dashboard page and all of the selected filters are discarded. If you add an instance of a widget you had previously closed. it opens with the default filters (for example, your default property).
To close a widget:
-
Click the Close button in the top right corner of the widget's title bar.
A dialog box opens asking you to confirm your choice.
-
Click OK.
The widget is removed from your dashboard. You may need to adjust the page layout.
Dashboard Widgets
The following widgets are currently available:
Maintenance Costs and Labor
This dashboard widget displays labor costs, material costs, other costs, and labor hours for all requests that were closed in the last quarter. This widget does not show costs for any work orders that are not in a Closed status (for example, Open, In Progress, or Waiting for Parts).
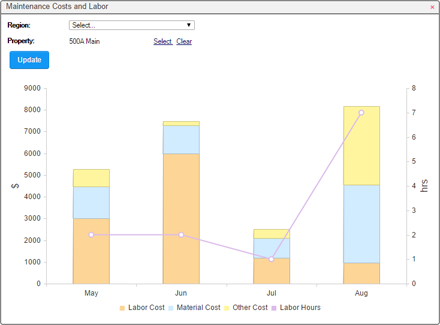
The bars indicate the total labor, material, and other costs accrued in a month. The purple labor line indicates the number of labor hours accrued in a month. When your cursor hovers over a data block in a bar, the amount of material, labor, or other cost appears. When your cursor hovers over a data point on the labor line, the total number of labor hours for that month appears.
You can filter the data by:
- Region – Select a value to only include data for a particular region.
- Property – Click the Select link to only include data for a particular property.
Open WO By Status
This dashboard widget displays the percentage of open work orders broken down by their current status (Open, In Progress, Waiting for Parts). It does not include closed work orders.
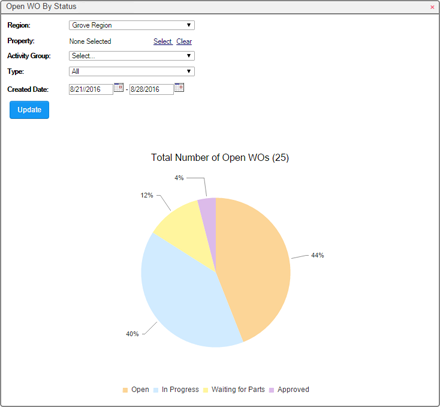
The legend at the bottom of the chart indicates the status value that each pie segment represents. When your cursor hovers over a segment in the chart, the exact percentage value appears. If you click a segment, the Find Request page opens displaying a filtered list of the work orders in the selected status.
You can filter the data by:
- Region – Select a value to only include data for a particular region.
- Property – Click the Select link to only include data for a particular property.
- Activity Group – Select a value to only include data for work types/subTypes within a particular activity group.
- Type – Select a value to include data for All work orders, Reactive (non-scheduled) work orders, or Preventative (scheduled) work orders.
- Created Date – Enter two date values to only include data for work orders that were created within the specified date range.
Average Building Inspection Scores
This dashboard widget displays a list of properties with the ten lowest and ten highest average inspection score over the past six months. This widget can help indicate which buildings might need immediate attention.
Only users who have security rights to the Inventory module can access this widget.
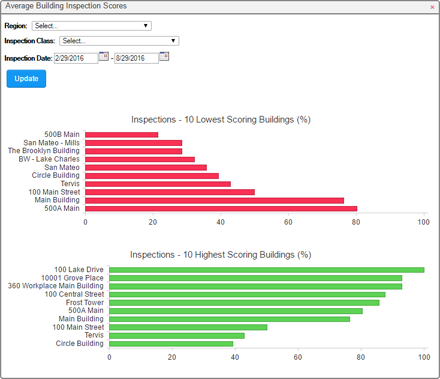
When your cursor hovers over a bar in the graph, the exact score for that building appears. If you click a bar in the graph, the Find Inspection page opens displaying a list of the inspections that were used to calculate the score.
You can filter the data by:
- Region – Select a value to only include data for a particular region.
- Inspection Class – Select a value to only include data for a particular inspection class.
- Inspection Date – Enter two date values to only include data for inspections that have occurred within the specified date range.
Open Requests Assigned to Me
This dashboard widget displays the number of work requests assigned to you, categorized by Complete By date.
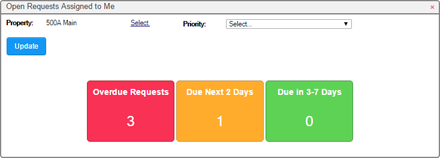
Requests are separated into three categories:
- Overdue Requests – requests that should have been completed but are still open
- Due Next 2 Days – request that are due to be completed within the next 2 days
- Due in 3 - 7 Days – request that are due to be completed within the next 3 to 7 days
Requests that are more than seven days out are not included. If you click one of the colored squares, the My Requests page opens, displaying a filtered list of the work orders in the selected category.
You can filter the data by:
- Property – Click the Select link to only include data for a particular property.
- Priority – Select a value to only include data for requests that were assigned a particular priority.
Open Requests By Property
This dashboard widget displays the number of upcoming work requests at a particular property, categorized by Completion Date.
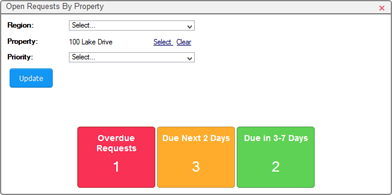
Requests are separated into three categories:
- Overdue Requests – requests that should have been completed but are still open
- Due Next 2 Days – request that are due to be completed within the next 2 days
- Due in 3 - 7 Days – request that are due to be completed within the next 3 to 7 days
Requests that are more than seven days out are not included. If you click one of the colored squares, the My Requests page opens, displaying a filtered list of the work orders in the selected category.
You can filter the data by:
- Region – Select a value to only include data for a particular region.
- Property – Click the Select link to only include data for a particular property.
- Priority – Select a value to only include data for requests that were assigned a particular priority.
Count By Origination Code
This dashboard widget displays the number of open work orders broken down by their Origination Code. The origination code indicates where the work order originated from, for example, Internet, Schedule, or as the result of a failed Inspection. This widget does not include closed work orders.
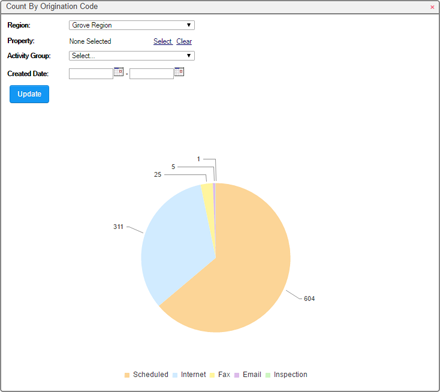
The legend at the bottom of the chart indicates the origination code that each pie segment represents. When your cursor hovers over a segment in the chart, the exact number of work orders appears. If you click a segment, the Find Request page opens displaying a filtered list of the work orders with the selected origination code.
You can filter the data by:
- Region – Select a value to only include data for a particular region.
- Property – Click the Select link to only include data for a particular property.
- Activity Group – Select a value to only include data for work types/subTypes within a particular activity group.
- Type – Select a value to include data for All work orders, Reactive (non-scheduled) work orders, or Preventative (scheduled) work orders.
- Created Date – Enter two date values to only include data for work orders that were created within the specified date range.