Logbook Dashboard – Aging
The Aging dashboard provides information about the number of days work orders are overdue within a given month (their anticipated age) as well as a historical view of the work orders that have been completed.
Specify any of the following criteria to filter the information displayed and then click FIND.
-
Region – Select a value to only include data for a particular region.
-
Property – Click the Select link to only include data for a particular property.
-
Activity – Select a value to only include data for work types/subTypes within a particular activity group.
-
Date Range – Enter two date values to only include data for work orders within the specified date range.
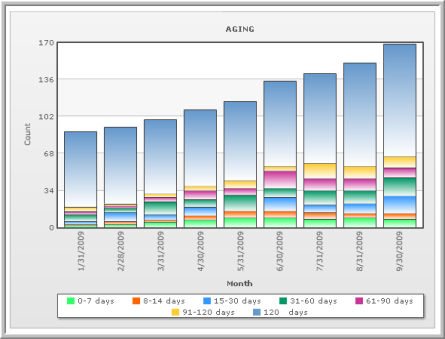
Aging
The Aging pane displays a bar graph indicating the number of days that a work order is, or will be, overdue (depending on whether you select a historical or future date range) at the end of a given month. The dashboard only includes work orders that have an SLA Estimated Complete date, and are not Complete or Entered in Error. It includes all work orders where Exclude from SLA Reporting=Yes, and work orders that are On Hold.
The Days Overdue value represents the number of business days as measured using the property configuration value. For example, consider a property where SLA Excludes Weekends = Yes, and a holiday schedule is in place. A request that was due on 3/1/2009 will be evaluated at the end of the month of March as being 21 days overdue. This is because there are 30 days in March (03/31 – 03/01= 30 days), but the 8 weekend days and the 1 holiday would also be excluded. This makes the request 30 – 8 – 1 = 21 days overdue.
Work requests that are due in one month may be 0 – 7 days overdue, and in the next month may fall into the 8 – 14 days overdue range. When looking historically, requests that fall into a specific category in one month may not be included in that category the following month if Closed within that month. For example, a request that is 97 days overdue as of Feb 28th but is closed in March is no longer overdue ad will not be displayed in March.
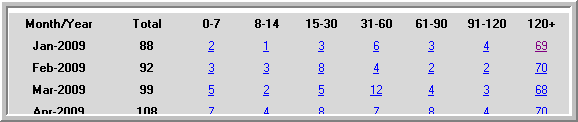
Aging requests are also displayed in a table format. Rows represent the end of the month and columns represent the number of days the work requests are overdue. For example, if a work request is due Feb 24 and is still open as of Feb 28th, it would fall into the 0 – 7 category (28 – 24 = 4 days overdue). Click a number link to view the requests associated with that number.
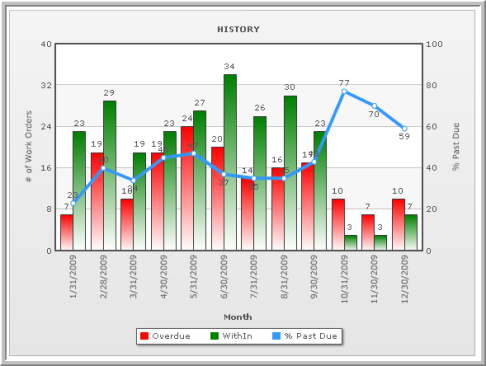
History
The History pane displays work orders that are overdue or on time as of the end of the specific month. All work orders listed in future months are listed as overdue, even if the SLA EST Completion date is in the future. There must be an SLA EST Completion date established for a request to be included in the graph. All items that are still OPEN are listed.