Accruent Analytics
Accruent Analytics is the reporting tool that allows you to run, modify, and create reports and dashboards using data from 360Facility and Famis, as well as from other Accruent solutions.
Using Accruent Analytics you can:
-
Run existing reports and dashboards – Reports created by Accruent or by your organization's report authors can be shared and run by anyone in your organization.
-
Work with the data in a report – Using filters, summaries, sorts, and calculations you can compare and analyze the data contained within a report.
-
Modify the appearance of existing reports and dashboards – Report authors can improve the layout of reports by creating a chart, adding a title, specifying text and border styles, or reordering columns for easy comparison.
-
Create your own reports and dashboards – Report authors can create new reports and dashboards, from scratch, using a selected data model.
You need a Report Author license to access the content creation features in Accruent Analytics. Otherwise, you can only run existing reports. Report Author permissions are granted based on your contract with Accruent. Contact 360Facility/Famis Support or your Accruent Account Representative for more information.
Reports and dashboards each offer distinct insights into your 360Facility/Famis data.
Reports
Reports provide static snapshots of the data. They can be as simple as a single graph or as complex as an entire book of information itemizing every detail of your data.
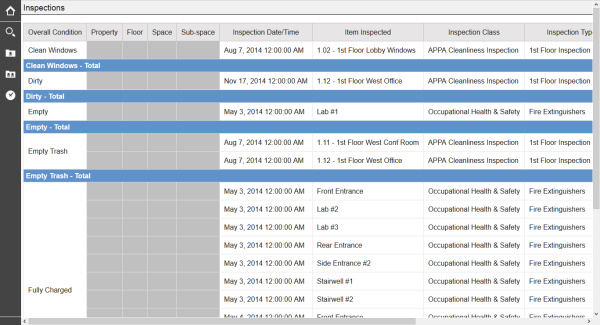
When authoring a report, you are given a great deal of control over the layout and methods of displaying the information. Reports can be output in many formats, such as HTML, Excel, PDF, or CSV.
Dashboards
Dashboards are live summations of the data that are highly interactive and allow for the ability to filter and drill into the data. Dashboards tend to focus on a few Key Performance Indicators (KPIs).
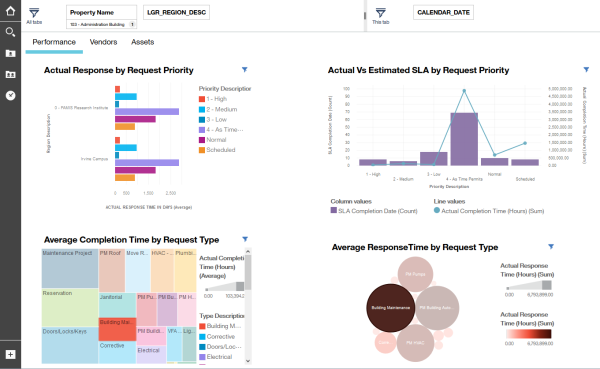
Dashboards can contain multiple tabbed panes of information and each tab can contain several types of widgets that you use to create visualizations of data that users can interact with. All of the widgets on a dashboard can be linked together so as you filter or drill into your data, all corresponding widgets automatically update.
Accruent Analytics can be accessed directly through a link in the 360Facility/Famis application.
To access Accruent Analytics:
-
Sign in to 360Facility/Famis.
The Accruent header appears at the top of the page.
-
Click the bar chart button.
The Accruent Analytics Home page opens with links to recent reports and dashboards.
Users who access Accruent Analytics directly (as opposed to accessing through SSO from the 360Facility application) can do so by using this URL: https://FAMIS-360Facility-analytics.accruent.com/bi/. The page includes instructions for signing in.
The following navigation tools are available along the top of the page in Accruent Analytics:

|
Home – Contains a list of all open reports, dashboards, and other content
|

|
Quick links – Contains links to navigate to shared reports and dashboards
|

|
More – Enables you to set a page as the home page
|

|
Notifications – Contains notifications, including links to reports run on a schedule
|

|
User Account – Contains options for setting your user account preferences
|
The following navigation tools are available along the side of the page:

|
Home – Click to return to your user-defined Home page
|

|
Search – Click to search for a specific report, dashboard, or other content
|
|
My content – Click to access reports, dashboards, or other content that you created and do not want to share with others
|
|
Team content – Click to access reports, dashboards, or other content that are shared with others on your team
|

|
Recent – Click to access recently viewed reports, dashboards, or other content
|

|
New – Click to create a new report, dashboard, or story
|
The My content and Team content folders, displayed in the sidebar navigation, are where reports, report definitions, dashboards, and data models can be stored.
-
The My content folder is where any content you want to keep private is stored. This is a good location to store reports with sensitive information or working versions that are still being revised.
-
The Team content folder is visible to all individuals who have access to your Accruent Analytics site. This folder will contain any standard reports and dashboards created by Accruent as well as any custom reports or dashboards created by other report authors that have been shared.
If you have access to the Report Authoring tools, you can share reports and dashboards you create by copying them from your My content folder to the Team content folder.
If you want to further organize your content folders, you can click the plus button  to create subfolders within the My content or Team content folders.